A List of The 25 Best Ruby on...
May 8, 2024
Home >> Node.JS >> How to find and fix issues in your Node.js app the smart way?
Quick Summary
Debugging is a crucial step in the development process of computer software. One skill that any developer should be able to perform is the ability to identify and correct errors in their code. It is the skill of finding and fixing flaws. Effective debugging can save you many hours of frustration and enhance the quality of the software you are developing when working with Node.js, a popular runtime environment for developing server-side applications. Throughout this comprehensive article, we will explore a range of techniques and resources to help you effectively Debug Node js applications.
Occasionally, we may encounter challenging issues while working on any online project. In these cases, we will debug the backend code to understand the situation better. The ability to debug enables us to look into these problematic scenarios. With the help of this ability, we can see exactly how each of our code lines is executed one by one. Furthermore, after a single instruction has been completed, we can examine the values of the variable.
Because debugging is such an underappreciated skill, developers occasionally disregard it. This skill improves your comprehension of code and development abilities, allowing you to write code that works effectively. Including the console.log() function in your code is only sometimes a good idea because it takes a lot of time to complete.
The next subject we’ll cover before continuing is troubleshooting a Node.js application.
Before debugging Node.js applications, it’s crucial to have a foundational understanding of Node.js, particularly with the Express framework, and a grasp of basic JavaScript concepts. These prerequisites form the basis for effective debugging and troubleshooting in Node.js development.
“Nodе.js Pеrformancе Optimization: 10 Easy Ways to Makе Your App Fastеr “
– Also Read Article
Here is the step-by-step guide for debugging Node.js applications:
The first project you can pick should be a straightforward Node.js application with a single API. Any form of Node.js project can be used.
Now, in a reasonably straightforward application, you can select items from an array according to the type supplied in the query parameters.
We are using nodemon to debug the Node.js application. The following command should be utilized to install Nodemon:
npm install -g nodemon
or
yarn global add nodemon
We must use nodemon to serve the node.js application once the installation is finished. We’ll utilize the following command to do this:
nodemon -L –inspect app.js
When you perform this command, your application will be transmitted to a given port. In this case, the node.js application’s main file is app.js.
Now is the moment to launch Visual Studio Code’s debugger. Open Visual Studio Code’s command panel to start using the debugger. Hit the Command key, Shift key, and p on macOS, or the Ctrl key, Shift key, and p key to open the command palette. As a result, the following section will open:
All you have to do now is write “Debug: Attach,” and “Debug: Attach Node Process” will be displayed as an option.
Please be aware that they are just node processes running on your machine. The debug controller that appears.
Our debugger is up and running, so we are almost done. We just need to add some breakpoints to cause the execution to stop at that point.
Debugging Controller: The debug controller’s components have numbers assigned to them; you can determine their functions by following the numbers by their respective numbers. This is the debugging controller:
Debug controller
Below are thorough descriptions of each section.
Breakpoint: The usage of breakpoints, which instruct debuggers when to halt program execution, is one of the most crucial components of debugging. Adding breakpoints to your code is simply tailing to a debugger, which will stop the code’s execution here and follow the variables’ values that have been run.
Click on the left side of the editor (placed on the left side of the line number column) to apply breakpoints. There are other breakpoints as well in the screenshot that follows.
Now that you have inserted the breakpoint, the execution will stop; let’s use the debugger and examine how it functions.
Steps 2 and 3 should be followed to start the debugger. Let’s move on to the endpoint, where the code will be executed after the debugger has been turned on.
When you get to the appropriate endpoint or the point at which the code segment for which you have designated the breakpoints begins to execute, you will see something like this screen:
Run the debugger with breakpoints.
This is how it looks when the execution has been stopped. The information displayed here is complete, and your code is being run line by line. To help you better understand how to troubleshoot a Node.js application, please allow us to explain these areas.
Variable section: You will also see the values associated with every variable. You may notice that some variables are null or undefined. This can be attributed to the variable’s execution having been stopped. You can see the variable’s actual value after it has finished executing.
Breakpoints: In this section, you can find all the breakpoints you have added throughout the project. Managing every breakpoint in one place is the responsibility of this component.
Call Stack: It is just a list of all the executions that have occurred; for example, you can view all the executions that took place before the one you are currently viewing.
Are you struggling to debug your Node.js application?
Don’t waste time trying to fix the problem on your own. Hire Node js developer today and get your application running smoothly again.
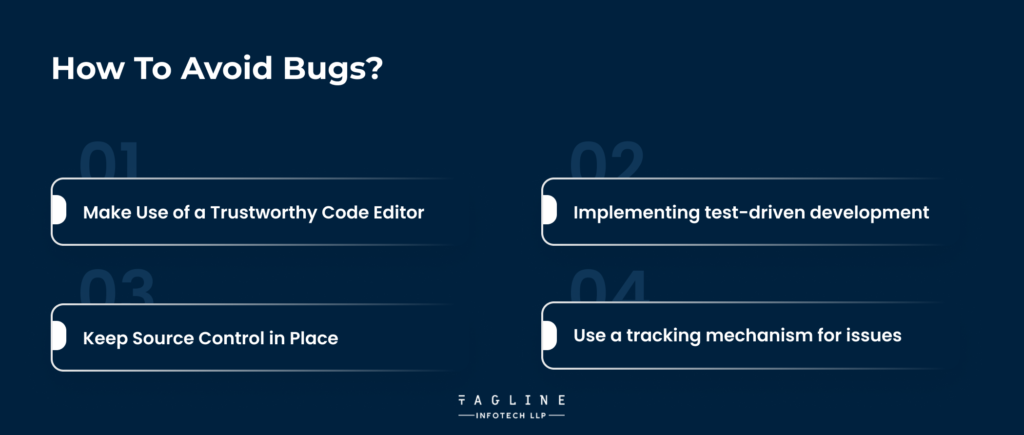
Preventing issues from arising is typically feasible before you test your application:
Line numbering, auto-completion, colour coding, bracket matching, formatting, auto-indentation, variable renaming, snippet reuse, object inspection, function navigation, parameter prompts, refactoring, unreachable code detection, suggestions, type checking, and many other features are all features that a good code editor should have.
Developers using Node.js have several tools, including various commercial solutions and free editors such as Visual Studio Code, Atom, and Brackets.
TDD, or test-driven development, is an approach to software development that encourages programmers to create code that simulates a function’s behaviour before the function is built. One example of test-driven development (TDD) is determining whether function Y returns X when input Z is provided.
Tests can be run while the code is produced to show that a function is operating as intended and to find any issues that might crop up when more changes are made. To make matters worse, there’s a chance that some of your tests have flaws.
Revision control and code protection can be enhanced using a source control system like Git. Determining when and where a bug was introduced and who must be held responsible will be simpler! Two online repositories that offer free storage space and management features are GitHub and Bitbucket.
If nobody knows about a bug, how big of an impact does it have? An issue-tracking system can assist with several tasks, including reporting defects, finding duplicates, recording reproduction procedures, assessing severity, setting priorities, allocating developers, documenting conversations, and tracking the status of any changes.
Basic issue-tracking features are usually included in web-based source repositories, although more involved teams and projects may benefit more from specialized solutions.
For any developer, debugging Node.js programs effectively is a crucial competency. Whether you are working with complex dependencies, asynchronous code, or performance bottlenecks, you can effectively detect and resolve issues with the help of the techniques and resources covered in this lesson. If you master debugging, you can create Node.js applications that are more resilient, efficient, and dependable. These programs will be able to meet the needs of contemporary software development. Consider partnering with a reliable Node.js development company to further enhance your application development process.
Remember that debugging is an opportunity to learn and improve your coding abilities in addition to providing a means of addressing issues. As a result, you ought to be eager to tackle the difficulties, research debugging techniques, and advance your Node.js development abilities. Enjoy yourself while repairing bugs
No, NodeJs is not so bad at handling errors. It depends upon the developers and how they decide to handle errors while building NodeJs apps.
You can use try-catch blocks to handle some of the most exceptions while building a NodeJs app and handling errors to make sure that code is much cleaner.

May 8, 2024

May 8, 2024

May 8, 2024

Digital Valley, 423, Apple Square, beside Lajamni Chowk, Mota Varachha, Surat, Gujarat 394101
+91 9913 808 2851133 Sampley Ln Leander, Texas, 78641
52 Godalming Avenue, wallington, London - SM6 8NW