The Ultimate Checklist for Hiring React JS Developers...
February 20, 2025
Home >> Power Bi >> Power BI vs Tableau: Choosing the Best Data Visualization Tool 2024

A successful decision-making process strikes a balance between decisiveness and caution, therefore communicating information promptly is highly desired in all types of enterprises. This idea is central to data visualisation; typically, a single graphic or chart can depict and explain hundreds of statistics and words.
Business Intelligence technologies such as Tableau and Microsoft Power BI may be used to produce similar visualisations.
Power BI is a Microsoft enterprise analytics solution that may examine and visualize facts, extract insights, and distribute them across several departments within your company.
Tableau, then again, is a robust Business Intelligence utility that manages points, goes with the flow and converts data into beneficial statistics.
It may also generate many visualizations to give facts and exhibit insights interactively.
Here we discuss comparison between Power BI vs Tableau to choosing best data visualization tools for you.
Business intelligence is an older practise than the digital age. The phrase was initially used in the 1860s to describe an American banker who gathered and analysed data to get actionable insights and stay ahead of the competition.
Things have progressed significantly since then, with modern organisations now having access to ever-increasing volumes of data.
As a result of such an inflow of data, numerous organisations have developed software to assist businesses in making sense of large amounts of data.
Tableau debuted in 2004, offering users a drag-and-drop interface for creating interactive visualisations and dashboards. In actuality,
Tableau offers a number of tools that assist organisations in storing, analysing, and visualising data.
Microsoft Power BI debuted some years later, initially making its public debut in 2011. Again, the goal was to build an intuitive interface that would allow non-programmers to organise and visualise data.
Power BI, like Tableau, is made up of multiple separate components. In this articles, you can learn more about Tableau and Power BI.
At its most advanced, Power BI enables organisations to extract raw data from a variety of cloud-based (SaaS) systems and turn it into actionable data via a sophisticated, interactive, and user-friendly user interface (UI).
Furthermore, the platform separates what is vital in order to deliver invaluable insights into the data that specific users require.
Feature of Power BI
With Power BI users might examine, visualize, and share facts in quite a few forms. Power BI is a complete commercial enterprise analytics tool. The major attributes of Power BI are:
Tableau is a software company that provides collaborative statistics visualisation gear to organisations that use business information analytics.
Tableau is used by corporations to visualize facts and spotlight trends for enterprise intelligence evaluation, making the statistics more intelligible.
Tableau was founded in 1999 to commercialize technology from the Stanford Department of Computer Science.
Tableau delivers reporting, dashboarding and scorecards, ad hoc analysis and queries, online analytical processing, data discovery, BI search, spreadsheet integration, and other data analytics and analysis services.
Managers, analysts, and executives can identify the links between multiple data points by making the data easier to interpret, independent of their technical skill level.
Feature of Tableau
Tableau is an effective tool for analyzing and sharing data that helps customers analyze and share data in a variety of ways. Here are some important functions:
There are several significant similarities between Power BI and Tableau:
Gartner facts suggest that Power BI and Tableau is the most popular tool in enterprise intelligence.
Power BI slightly outperforms Tableau, scoring 4.3 out of 5 stars from over 2100 reviews, with an average rating of 4.4 from over 2500 reviews.
You can use Tableau or Power BI to show your statistics in plenty of methods. Data may be supplied in charts, graphs or maps the usage of different visualization options.
These visualizations can be interacted with by using hovering over them for extra facts or applying filters.
Additionally, you can integrate those visualizations to create an interactive dashboard.
Both Tableau (Tableau) and Power BI (Power BI BI) aid a extensive variety of data assets, from MS Excel to CSV to JSON, and you can combination your records from any of those sources.
The paid variations of both systems additionally encompass Google Bigquery (GBI), Amazon Redshift (Redshift), Salesforce (Sellforce), and over 50+ other data connectors. Let’s dive in.
You can directly import data from your very own records sources. If the underlying records is changed, your visualization may be up to date accordingly.
One of the pleasant matters approximately using BI equipment is that you don’t want to have any coding information.
You can use Tableau or Power BI to analyze facts without any coding knowledge. Both of these equipment are smooth to apply, and if you’re new to studying records, they’re ideal for you.
Tableau and Power BI are becoming more and more similar after recent updates. For instance, Power BI has enhanced its data preparation features, while Tableau has introduced a new tool called Tableau Prep that offers top-notch data preparation.
Empower your data-driven journey with Power BI and Tableau?
Hire our expert to explore the dynamic capabilities of Power BI and Tableau, and make an informed choice today.

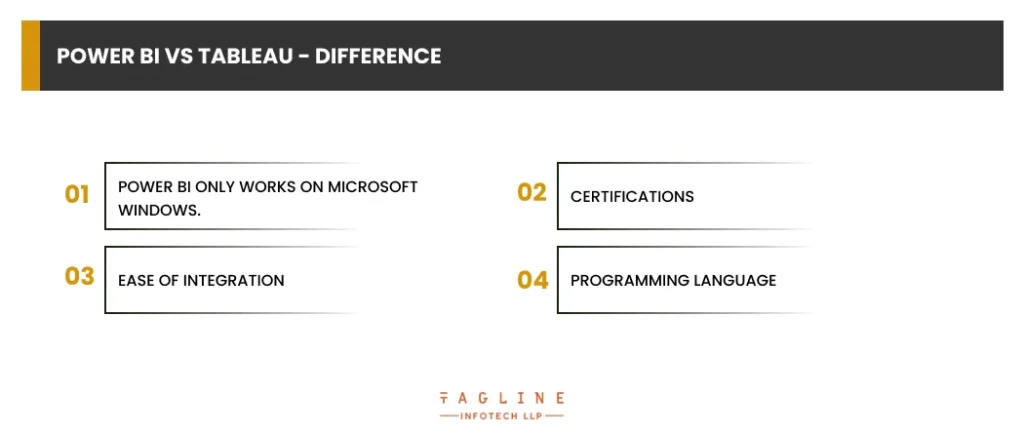
There are several differences between Tableau and Power BI that you should be aware of if you want to use either one in your business or profession. Knowing these differences can help you choose between the two.
The decision between the two platforms may become much simpler as a result. Tableau would be a better option if you plan to use a Mac for work most of the time, as Power BI is incompatible with Macs.
A more excellent range of choices tailored to particular occupations are available in Tableau. There are associate, specialist, and analyst levels; further information on them may be found on the Tableau website.
By enrolling in a series of courses at DataCamp that will help you get your Tableau certification, you can also learn how to become a data analyst with Tableau.
According to the level, the official Tableau certification runs between $100 and $250.All of the critical features of the Power BI platform are covered under a single certification. For $165, you may take the
PL-300: Microsoft Power BI Data Analyst test. One further significant distinction between the certificates is that, although Power BI provides its test in several languages, Tableau only offers its Certified Professional test in English at this time.
It will be simpler to incorporate Power BI into your workstation if you utilize Office software because Microsoft designed it.
The recent acquisition of Tableau by Salesforce also makes them a viable option because of their native integration. But because both can link to programs such as Excel and Salesforce, the real question is which would work best for you.
There are other distinctions when utilizing each with various programming languages:
Power BI
For data modeling and manipulation, Power BI supports the Data Analysis Expression and M language. Microsoft Revolution Analytics is another tool you may use to link the R programming language.
Tableau
Tableau gives you more options and freedom. Additionally, Tableau Software Development Kit can be integrated with R, Python, Java, C, and C++.
Given that these are likely the most significant differences between Power BI and Tableau’s costs, it is worthwhile to examine them in further depth.
Both Power BI and Tableau have been designed to work with large amounts of data. They offer a variety of connection and storage options.
Some of these tools are designed to handle large amounts of data, while others are designed to provide real-time dashboard updates.
When dealing with large data sets, Tableau often outperforms Power BI. Power BI, on the other hand, tends to run more quickly when dealing with smaller sets of data. Again, the best tool for your needs will depend on what you’re trying to achieve.
When it comes to the UI and UX, virtually nothing separates the two; the only factor is preference.
Users may examine their data in a way that feels comfortable because both are designed to be simple to use and intuitive. Either one will be as simple for you to learn.
Each tool has certain qualities that make it stand out. When deciding between these two options, factors such who will use the tool (stakeholders or data analysts), their needs, the size of the firm using the tool, the volume of data being employed, etc., must be taken into account.
Power BI has been created with straightforward features that make it easy to learn. Therefore, it may be used by stakeholders who want to analyze data but require further training.
The Tableau user interface might be made more understandable to facilitate learning. It may thus be used by data analysts who are skilled with data science and visualization.
Tableau is therefore better due to its speed and additional functionality, whilst Power BI is preferable due to its simplicity.
Which should you choose, Tableau or Power BI? There is no question that there is a lot of overlap between these two great tools.
For certain users, learning both may be the best course of action. For those who choose to pick between the two, there are differences in cost and accessibility that must be considered.
Take into account the system you’ll be utilizing it on, the amount of data you’ll be processing, whether or not programming languages are required for your line of work, and whether or not you wish to seek certification.
DataCamp offers a selection of Tableau and Power BI training. Our courses cover topics like integrating data and creating dashboards and let you practice using each tool’s user interface without having to install anything.
We discussed the fundamental details and significant distinctions between the two potent business intelligence and data visualization technologies in this blog.
The choice of one depends on the circumstances. Before choosing between the two, there are a number of factors to be taken into account.
The final objective is to get valuable insights from the data, and in order to do so, the technicians must make a sensible choice.
Tableau provides associate, specialist, and analyst certification levels that are suited to specific tasks.
Tableau has a 16-column display limit.
The ability to produce automatic reports is not available in Tableau; changes must be performed manually.
Power BI provides flexible visualization choices, simple data integration, and support for several data sources for practical analysis.

Digital Valley, 423, Apple Square, beside Lajamni Chowk, Mota Varachha, Surat, Gujarat 394101
D-401, titanium city center, 100 feet anand nagar road, Ahmedabad-380015
+91 9913 808 2851133 Sampley Ln Leander, Texas, 78641
52 Godalming Avenue, wallington, London - SM6 8NW