Data is all around us and is becoming an increasingly important part of our lives. Every day, we collect, send, and analyze data. Data by itself is not visually appealing, but we can change that. Charts make data more visually appealing while also making it easier to understand and remember because it is easier to engage with information when there are coordinating visuals to focus on.
There are numerous ways to display charts in your work when developing websites or applications. You can create your charts from scratch or use one of the many React chart libraries available. In this guide, we’ll compare the best React data visualization library for your applications.
What is a React Chart Library?
React Chart Libraries, also known as React apps, are responsible for visualizing data, managing libraries, allowing users to write and design components, and assisting them in data maintenance. These adaptable and scalable apps rely on frameworks that are both functional and long-lasting.
React Chart Libraries are an excellent resource for web developers who want to incorporate meaningful data into their projects. These apps essentially assist web developers in displaying how a specific application or feature is currently working or is expected to work in the near future. They can also be considered a boon to web developers because they have forced them to shift their focus to producing actual data rather than worrying about its design and presentation.
The chart is a standard component of both mobile and web apps. Different types of charts provide different types of data. Digital charts are popular because they allow us to understand and collect critical data in formats that are specific to our needs. Charts for React are also simpler to use and include line charts, bar charts, pie charts, Gantt charts, and bubble charts.
React app libraries are another name for React chart libraries. These apps are adaptable and scalable, and they make use of frameworks that can be reused over time. Web developers looking to incorporate meaningful data into their web projects will find chart libraries for React to be a useful tool.
Are you seeking assistance to accelerate the progress of your project?
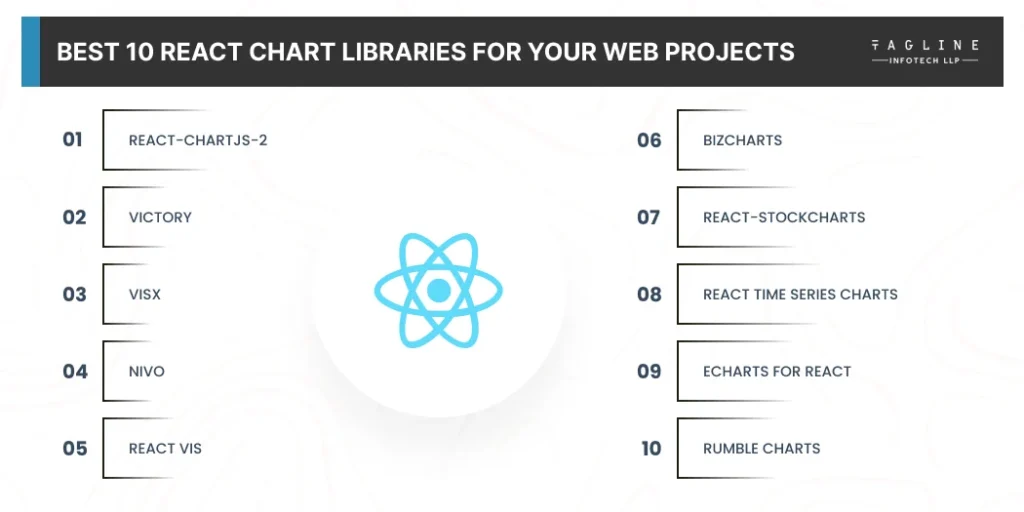
Best 10 React Chart Libraries For Your Web Projects
Many professionals are now switching to lightweight React chart libraries that include modular charting components for React to make their lives easier. In the midst of this conventional shift, we’ve compiled a list of the best and most popular React chart component libraries for your viewing pleasure. Let us begin without further ado:
React-chartjs-2
If you’ve used the chartjs charting library, you’ll recognise that React-chartjs-2 isn’t your typical react chart library. Instead, it is better understood as a react wrapper for chartjs, a JavaScript-specific charting library.
Chartjs is a beginner-friendly react chart library that uses HTML5 Canvas elements to build chart components that are unique in their types and kinds.
To use React-chartjs-2, you should be familiar with the Chartjs documentation. Because it is a simple framework, there should be few difficulties in doing so. This react chart library is worth a look, with 338,760 weekly downloads.
Victory
Victory is another popularreact chart library that has a collection of charting components which utilize the same API for all applications. It is used for React and React Native. Users can generate data in the form of charts for both Android and iOS applications using the same API. The library allows for simple cross-platform charting and is very easy to learn and use.
It also allows for the simple and easy integration of charts such as line, pie, bar, and candlestick to web and React Native applications. Victory, created by Formidable, has a weekly npm download rate of 126,898.
Visx
Visx, a new name in the field of React Chart Libraries developed by Airbnb, has received approximately 14.2k stars on GitHub, which is a significant accomplishment. The most significant advantage of using Visx as an active repository is that it systematically combines the benefits of React DOM and D3.js. It is the best react chart library that is used by many users.
The developers of Visx do not claim that it is a React graph library in the traditional sense. They see it instead as a set of low-level visualization components that can be easily reused. One can also look at the Bar Chart Example Code of this simple platform to gain a better and more in-depth understanding of how it works.
Nivo
Nivo provides a novel method for web developers to generate charts and other data on the server side. There are numerous and creative templates available for data visualisation and presentation purposes. The chart library provides unique and eye-catching options for displaying meaningful data.
Nivo provides SVG, HTML, and Canvas charts in a single charting library, as well as transitions. (or motions). If you need a precise and versatile solution for your data visualisation needs, Nivo is your one-stop shop.
It promises to provide an engaging user experience through the use of gradients in charts.
React vis
React vis is a pioneering name in the field of React Chart Libraries, created by the web developers of Uber Open Source. It provides a simple and quick way to understand component charting for your data visualisation needs.
Line charts, area charts, bar charts, pie charts, donut charts, contour plots, heat maps, hexagon heatmaps, scatterplots, pie and donut charts, sunbursts, radar charts, parallel coordinates, and treemaps are some of the most common data visualisation charts available.
Users value the documentation’s ability to design and select from a variety of charts. This is evidenced by the 8k stars it has received on GitHub in a short period of time.
BizCharts
Everyone has heard of the tech behemoth Alibaba. This behemoth’s creators also introduced BizCharts to the world of React Chart Libraries. Charting services are provided by Alibaba libraries for G2 and React-based business applications.
They provide an impressive and highly versatile template library. BizCharts is also known for having the most comprehensive collection of charts, making it a comprehensive base for designing and data visualisation. BizCharts receives a total of 20,452 npm downloads per week from the Asian population.
React-stockcharts
This react chart library is a must-have for anyone who wants to visualise their stock chart data in versatile yet simple templates. React stock charts are a one-stop shop for web developers looking for a platform to handle their financial data visualisation needs.
The platform includes over 60 technical indicators and has received 3.3k stars on GitHub. Many people, however, are unaware that this react chart library does not perform frequent updates or other maintenance services.
React time series charts
The react time series charts are an always-available react chart library that provides an organised set of charting features that are curated to suit the modular needs. These charting components aid in the systematic visualisation of network traffic and time-series data.
One notable feature of react time series charts is their low developer maintenance. They do, however, keep updating the platform with clear examples and extensive documentation, which compensates for the low maintenance.
eCharts for react
ECharts is a powerful, easy-to-use charting and visualisation tool that is ideal for commercial presentations. It is considered the best chart library for react because developers can use it for better visual presentation.
JavaScript is used to write ECharts to React. It makes use of the ZRender rendering engine, which supports both Canvas and SVG. Canvas and SVG are both supported by the ZRender rendering engine.
ECharts 5 builds on ECharts’ key functionalities, making it even easier for programmers to tell the story behind the data sets with new features and enhancements in story-telling and data appearance, augmented visualisation and responsive design, collaboration and performance enrichment, programmer experience, globalization, and more.
Fusion Charts
FusionCharts is a well-known JavaScript-based charting library that allows developers to create different types of interactive charts, maps, and dashboards by using JavaScript. It also offers easy-to-use react components to bind FusionCharts. It is one of the most reliable chart libraries that provide amazing visualization with extensive documentation.
One of the main benefits of FusionCharts is that charts created through this library can be easily displayed on low-performing devices without any delays.
Rumble charts
You can use the React graph visualization library to create flexible, composable charts to visualize your data. D3.js was used by the developers of Rumble Charts. However, it is not something you will experience the majority of the time. Many graph charts demonstrating options are included in the React graph chart library.
Rumble-charts, one of the anonymous charting libraries, is one of the react chart libraries. It is a set of components used to build flexible, reusable charts that allow you to visualise data. It is a straightforward app with modern templates.
Get your front end up to speed with the newest and most popular updates in the market!
Our passionate UI experts possess the necessary skills to excel in the competitive industrial landscape. Hire our front-end developers today and accomplish your business objectives.
Why Use React Chart Libraries?
Multiple Data Type Support
Rich Charting Potential
Enhanced Data Visualisation
Improved Efficiency and Better Speed
Cross-Browser Compatibility
Seamless Integration in Existing System
How to choose a charting library that aligns with your end goal?
Sometimes it is hard to choose the best JavaScript-based chart library and that’s why here I have mentioned some of the main factors that you need to consider before you choose a React chart library.
Customization
Every developer wants various customization options because it is the best way to ensure that the chart is appealing. If a developer gets customizability options in the chart library like in different colors, removing grid lines, editing legends, etc. then there is a huge possibility developer will use that library.
Cross-browser and Cross-device compatibility
The developers also need to remember that the chart library should be compatible in multiple browsers because you never know which user will open it in with the browser. Plus, it should be easily accessible on all the versions.
For data visualization, you also need to make sure that the React library for data visualization can be accessible on various mobile devices with multiple operating systems.
Available Charts
It is necessary to have multiple options when you are trying to add charts in the app. Whenever a developer has a wide range of React chart libraries then the developer can choose the library that offers better features.
Developers prefer to use the available React charts library rather than going for various third-party plugins.
Learning Curve and data format
The charting libraries should be easy to learn and have a short learning curve which means any developer can quickly learn to use them. Plus the developers also need to remember the input data format because the chart library should support different types of data types to ensure its popularity.
Conclusion
There are numerous advantages to using React chart libraries, ranging from simple integration to convenient comparison and, of course, chart and graph design. A data visualisation library presented in React apps simplifies your work. Use the top react chart libraries you’ve learned about to lighten your workload. Hope that the list of React Libraries is helpful and you can choose the best library for your upcoming project.
These open-source libraries are well-maintained and highly recommended by the React community. The best react charts libraries are intended to assist you in representing data in the best way possible. It is also useful for application development. As a result, select a library that meets all of your requirements. When selecting a diagram library or chart, keep in mind that they are all designed to help developers achieve a specific goal.
There is no single correct answer or simple solution to this question. The React chart library chosen is determined by individual factors that are unique to each person's needs. Various factors such as your ability to perform code, your willingness to design charts, gaining access to pre-existing libraries, and much more should be considered. It is recommended that one considers various factors and compares other React apps before making a decision.
Recharts, react-chartjs-2, Victory, visx, nivo, react-vis, BizCharts, Rumble Charts, ant design charts, react-gauge chart, and echart for react are some of the best and most popular react charting libraries for executing data visualisation projects. Each of these libraries has its own personality and offers slightly different services.
Recharts is one of the most popular react chart libraries. Following that are react-chartjs-2, Victory, nivo, and visx. These are the most popular and widely used react chart libraries for curating graphs and charts in your React-based web applications.
Web developers frequently select from a plethora of different react chart libraries. According to the developers, some of the most popular react chart libraries are Recharts, Nivo, Victory, and Visx. They are also among the most popular libraries.
Recharts is one of the best react chart libraries available today for web developers. However, the good news is that it is also the easiest to use and understand for newcomers who may feel overwhelmed by the process. Recharts is a good place to start because it explains the dynamics of data visualisation.
Tagline Infotecha well-known provider of IT services, is deeply committed to assisting other IT professionals in all facets of the industry. We continuously provide comprehensive and high-quality content and products that give customers a strategic edge and assist them in improving, expanding, and taking their business to new heights by using the power of technology. You may also find us on LinkedIn, Instagram, Facebook and Twitter.
Want to add stunning data visualizations to your React JS Project?
Contact our experienced React Js developers today to seamlessly integrate stunning data charts into your Project and create a visually appealing user experience.